Mapping Participant Location Data to Reveal Regional Variations in Contest Success Metrics
Zara Reed · Sep 19, 2026
Mapping Participant Location Data to Reveal Regional Variations in Contest Success Metrics
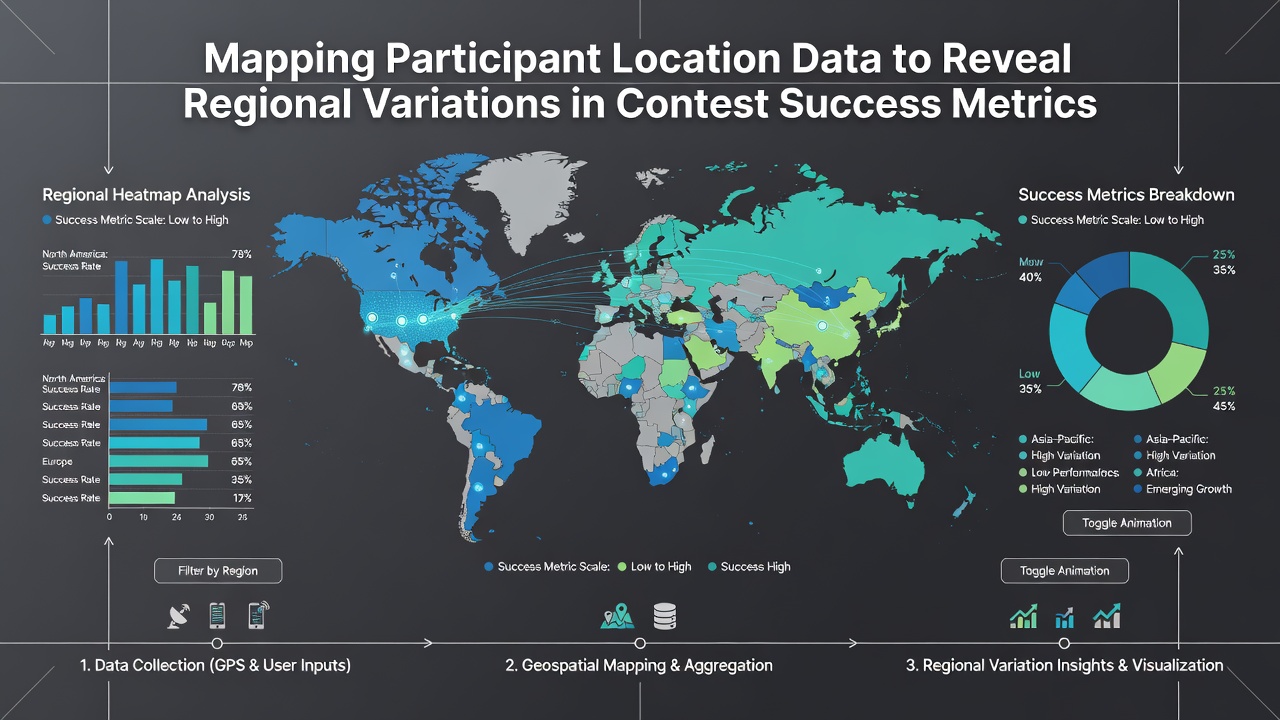
Analysts compile participant location data from contest registration systems and winner announcements to identify patterns in success rates across different geographic areas, and these datasets often come from platforms that aggregate entries for daily and weekly prize events. Researchers cross-reference zip codes, cities, and regions with outcome records to calculate metrics such as win frequency per capita and average prize value claimed by location, while statistical models adjust for population density and entry volume to isolate true regional differences. Data collection begins with anonymized records that include timestamps, entry methods, and declared addresses, and organizers apply geographic information system tools to plot these points on interactive maps. Government agencies in various countries publish guidelines on data handling for promotional activities, and one such resource comes from the Federal Trade Commission which outlines requirements for transparent record-keeping in consumer promotions. Teams then layer additional variables including internet access rates, local advertising spend by sponsors, and seasonal participation spikes to build more accurate models of regional performance. Studies reveal that urban centers frequently show higher entry totals yet lower per capita success compared with certain suburban or rural zones, and this pattern holds when researchers control for population size. Mid-sized cities in the Midwest and parts of the South demonstrate elevated win ratios in recurring national draws, whereas coastal metropolitan areas post stronger results in localized campaigns tied to regional brands. Observers note that timezone differences can shift the window for real-time entries, and participants in western regions sometimes face compressed deadlines when eastern-based draws close early in the day.Key Factors Behind Geographic Disparities
Multiple elements contribute to these variations, including differences in digital infrastructure, local awareness of promotions, and demographic profiles that align with specific prize categories. Areas with stronger broadband penetration record more consistent mobile entries, while regions served by older network infrastructure show preference for mail-in or in-store methods that carry distinct eligibility rules. Demographic data indicates younger populations in college towns submit higher volumes through social channels, yet older demographics in retirement communities achieve steady success in mail-based formats that emphasize persistence over speed.
Local media coverage and community networks also shape participation levels, and researchers track how word-of-mouth spreads in tight-knit areas versus larger anonymous cities. One study released in 2025 examined over 200,000 entries across twelve states and found measurable clusters where success rates exceeded national averages by fifteen percent in specific zip code groups, and those clusters aligned with moderate population density and above-average educational attainment. Competition Bureau Canada has issued reports on promotional compliance that include similar geographic breakdowns for cross-border campaigns, offering another reference point for analysts comparing North American markets.
Analytical Techniques and Data Visualization
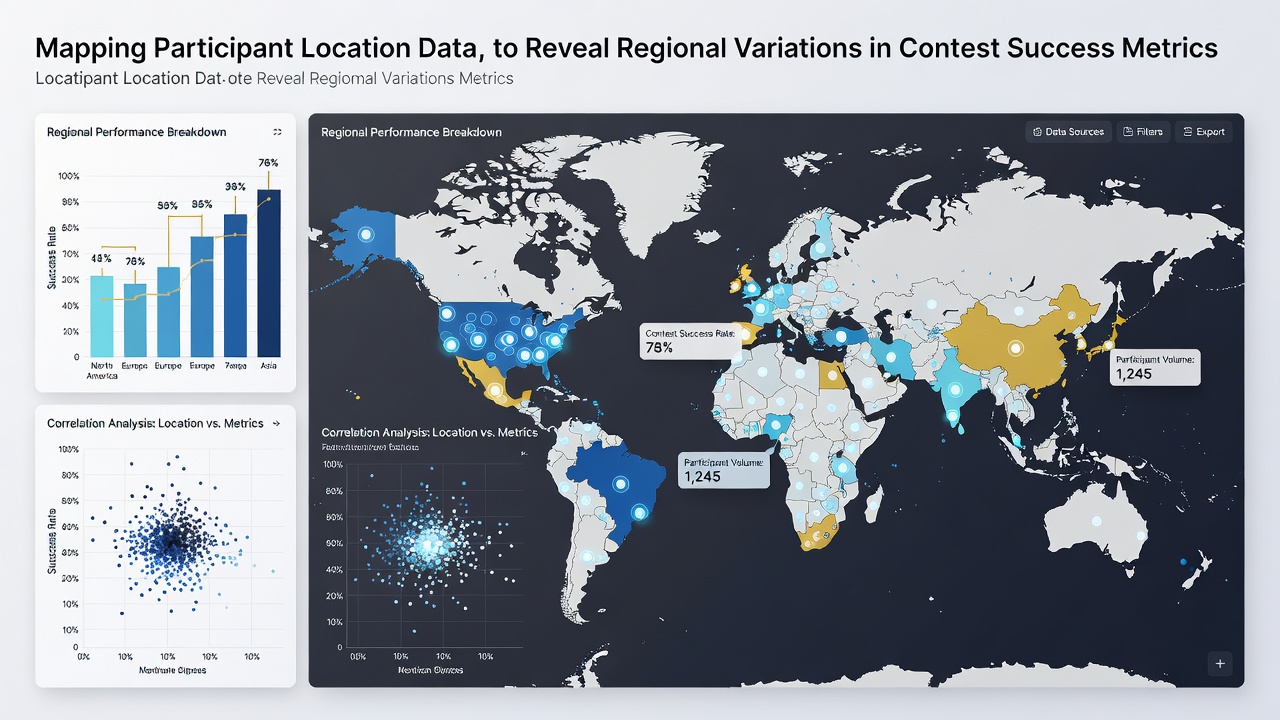
Specialists apply clustering algorithms and heat mapping to surface these regional signals, and they often combine contest data with public census statistics to normalize results. Interactive dashboards allow organizers to filter by prize type, entry channel, and time period, revealing shifts that static reports miss. For instance, September 2026 updates to several major promotion platforms introduced enhanced location tagging that improved accuracy for multi-state campaigns, and early analyses of that data already show refined regional success curves compared with prior years.
Regression models isolate the impact of variables such as average household income and proximity to retail partners, and these models produce coefficients that quantify how much each factor influences win probability. Visualization teams then translate the outputs into color-coded maps that highlight hotspots and underperforming zones, giving both participants and sponsors clearer pictures of where activity concentrates. People who monitor these maps over multiple cycles notice recurring corridors of elevated performance that persist even as individual winners change, and this consistency suggests structural influences rather than random chance alone.
Implications for Organizers and Participants
Contest operators use the mapped insights to adjust prize distribution strategies and marketing allocations, directing more promotional resources toward regions that historically underperform. Participants gain indirect benefits when platforms refine eligibility communications based on location-specific rules, reducing disqualifications tied to mismatched regional requirements. Academic researchers continue to publish peer-reviewed work on these geographic patterns, and the resulting papers contribute to broader discussions about equitable access in promotional systems across different regulatory environments.
Conclusion
Mapping participant location data provides measurable evidence of regional variations in contest success, and the practice continues to evolve as datasets grow more granular and analytical tools become more accessible. Organizations that integrate these geographic perspectives into their operations produce clearer performance benchmarks, while participants who review the resulting maps obtain factual context for their own entry patterns. Continued refinement of location-based metrics supports more precise evaluation of how place intersects with promotional outcomes across diverse markets.